Description: Create a infographic worthy of being posted on Pinterest. The infographic needs to contain at least 4 icons/graphics and have at least one chart.
Process (Programs, Tools, Skills, FOCUS principles): My first task was to gather cheese facts and statistics. I wanted to focus on illegal cheeses, because I thought that would be a fun direction to go. I found some examples of cheeses that are illegal to import into the U.S., but couldn’t find much information that could be put in quantifiable graphic form.
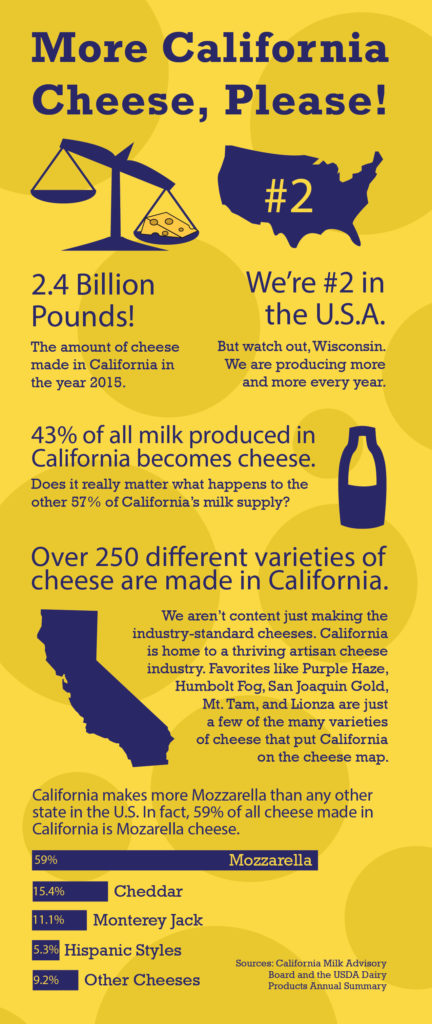
So I settled on California cheese. I spent a lot of time gathering information, and didn’t use even half of it.
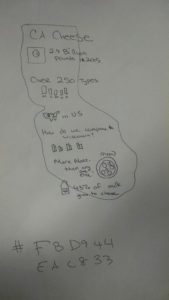 I created a sketch of how I wanted to lay out my infographic. I wanted the state of California as the background, with facts and figures on top.
Unfortunately, California isn’t as vertical as I had imagined, and there was no way to make this idea look good. I played around with many different layouts and background ideas until I decided on the cheese background.
I downloaded images of the the U.S. map, a California map, a milk bottle, and scale to trace with the pen tool in Adobe Illustrator. Brother Stucki’s weekly video came in handy in learning how to do that.
I had a little bit of a difficult time figuring out the graph tool in Illustrator. I worked around this by creating a bar graph in Excel, doing a screen print, and then using the cropped screen print to get the boxes in the bar graph to be the correct width. Eventually I need to learn how to use the graph tools in Illustrator. I was too tired and frustrated late Monday night to figure out how to get it to look exactly the way I wanted to.
Critique Report: I received Facebook feedback from Juanita Rodriguez and Amanda Peck. Amanda gave me a suggestion how to possibly use the state of CA as part of the graph. I thought it was a creative solution, but I liked the cleanness of the current graph.
In Brother Stucki’s video critique, he suggested I find some way to make the title stand out more. He also noted that I was one icon short of the 4-icon minimum, and suggested I incorporate the shape of California somewhere. I changed the font style of the title, made it bigger, and added a new section to the infographic to use the state of California.
Message: California cheese is awesome.
Audience: People who are still in denial about how good California cheese is, basically people from Wisconsin.
Top Thing Learned: I improved my knowledge of how to use Illustrator, especially in creating shapes. I learned that the graph tool exists, though I didn’t end up using it.
Color scheme and color names: For the first time this semester, I picked my color scheme before working on my project. I went with a split complementary scheme, with a yellow background, with indigo and violet elements. Partially due to the fact that I’m colorblind, it didn’t end up that way, but everyone seemed to like how it turned out anyway.
Title Font Name & Category: Myriad Pro, sans serif
Copy Font Name & Category: Rockwell, slab serif
Thumbnails of any original, unedited image used in the project: n/a
Source of each image (website name and hyper link): n/a
I love the match background. It’s subtle and not distracting but goes perfectly with the topic. I love how neat and readable your infographic is.
https://lyndsibarfield.wordpress.com/2016/06/08/8a-infographics/
https://mayhemdesigns.wordpress.com/2016/06/08/8a-infographic/comment-page-1/#comment-17
Graphic genius….This is probably one of my favorite designs for this project. Simple colors, great flow and icons. I feel the circles in the background could have been a little smaller but because of their opacity they don’t distract the eye. Awesome job!
My post: https://caribegrafix.wordpress.com/2016/06/09/173/
Juanita’s blog: https://juanitavisualmedia.wordpress.com/2016/06/09/infographic-project/
That looks really good. I like how the background is swiss cheese, good idea! The information is interesting too.
Here’s mine: https://byuvisualmedia.wordpress.com/2016/06/07/infographics/
Here’s a classmates: https://lyndsibarfield.wordpress.com/2016/06/08/8a-infographics/comment-page-1/#comment-13